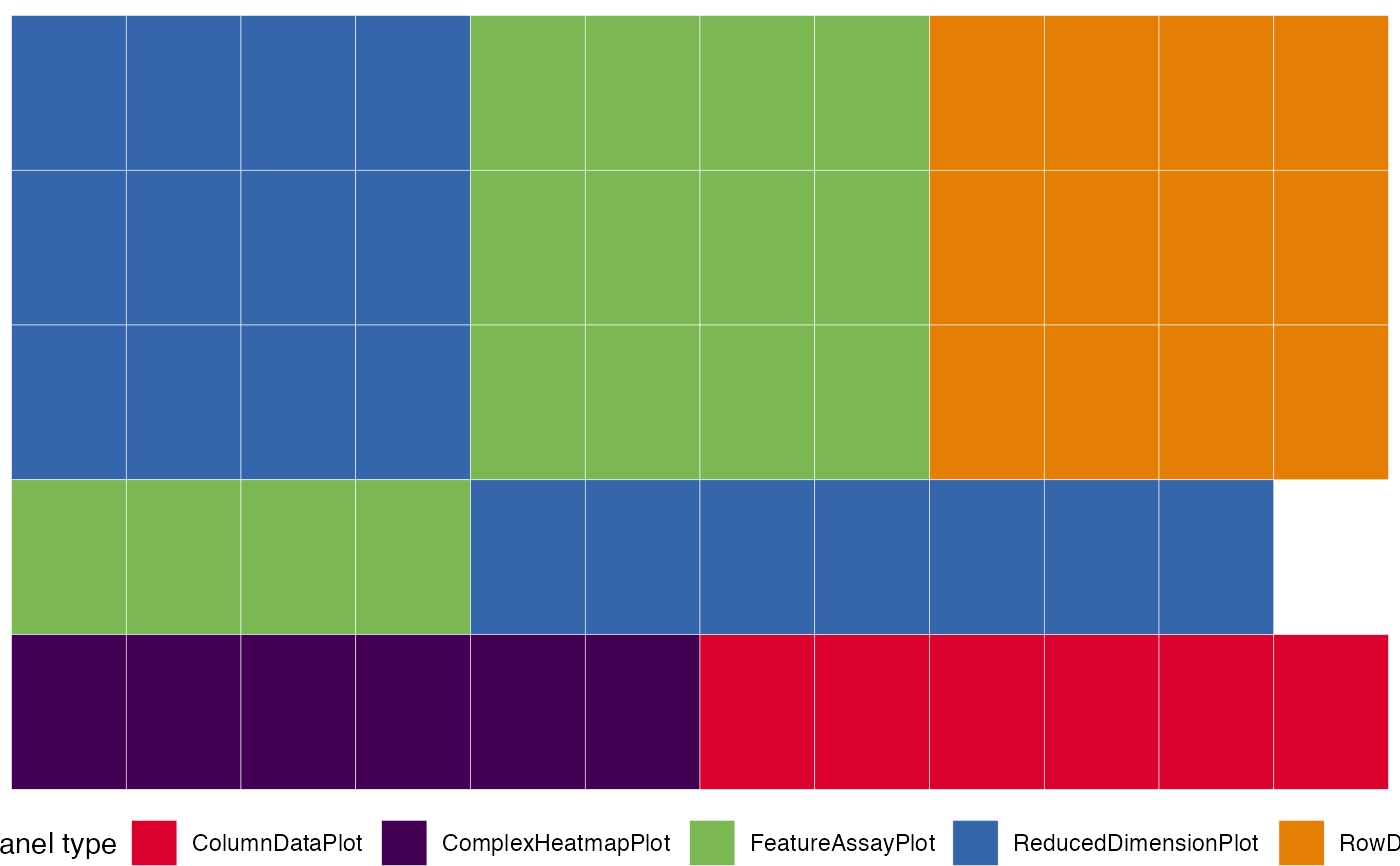
Previews the layout of the initial configuration object in a graphical form.
Arguments
- initial
An
initiallist object, in the format that is required to be passed as a parameter in the call toiSEE::iSEE().
Details
Tiles are used to represent the panel types, and reflect the values of their width. This can be a compact visualization to obtain an overview for the configuration, without the need of fully launching the app and loading the content of all panels
This function is particularly useful with mid-to-large initial objects, as
they can be quickly generated in a programmatic manner via the iSEEinit()
provided in this package.
Examples
## Load a dataset and preprocess this quickly
sce <- scRNAseq::RichardTCellData()
#> snapshotDate(): 2025-04-08
#> loading from cache
sce <- scuttle::logNormCounts(sce)
sce <- scater::runPCA(sce)
sce <- scater::runTSNE(sce)
## Select some features and aspects to focus on
gene_list <- c("ENSMUSG00000026581",
               "ENSMUSG00000005087",
               "ENSMUSG00000015437")
cluster <- "stimulus"
group <- "single cell quality"
initial <- iSEEinit(sce = sce,
                    features = gene_list,
                    clusters = cluster,
                    groups = group)

view_initial_tiles (initial)


## Continue your exploration directly within iSEE!
if (interactive())
  iSEE(sce, initial = initial)
#> Error in iSEE(sce, initial = initial): could not find function "iSEE"